Lesson Plan | Lesson Plan Tradisional | Graphics: Bars, Tables, Lines, Images
| Keywords | Bar Charts, Line Charts, Table, Pictorial Charts, Data Interpretation, Information Extraction, 5th Grade Math, Data Visualization, Student Engagement, Problem Solving |
| Resources | Whiteboard and markers, Projector or screen to display charts, Paper and pencils for jotting down notes, Printed examples of charts and tables, Visual aids (icons or images) for pictorial charts, Cards with questions for data interpretation exercises |
Objectives
Duration: 10 - 15 minutes
This stage aims to present the key objectives of the lesson to the students, preparing them to appreciate the relevance and practical application of charts and tables. It helps focus their attention and gives a clear context for the content to be covered, ensuring they understand what to expect throughout the lesson.
Objectives Utama:
1. Clarify the significance and utility of various chart types: column, line, bar, and tables.
2. Show how to interpret data presented in charts and tables.
3. Guide students in extracting specific information, such as participant numbers and percentages, from the charts.
Introduction
Duration: 10 - 15 minutes
✨ Purpose: This stage aims to contextualize the importance of charts in students' everyday lives, piquing their interest and enthusiasm for the topic. By linking the content to relatable examples and interesting facts, students will engage more deeply and understand the significance of learning about different types of charts and tables.
Did you know?
📊 Curiosity: Did you know that the popularisation of the bar chart can be credited to Scottish engineer William Playfair in 1786? He developed charts to depict England's trade balance. Nowadays, various charts—be it bars, lines, or tables—are integral across fields such as economics, health, and entertainment, simplifying the communication of complex data.
Contextualization
📝 Context: Begin the lesson by explaining that charts are crucial visual tools for clearly representing data. Inform students that they frequently encounter charts in daily life, from news articles to sports summaries and even social media updates. Stress that mastering the ability to read and interpret charts is vital, not just academically, but in real-world contexts as well.
Concepts
Duration: 60 - 70 minutes
📚 Purpose: This stage aims to provide students with a comprehensive and practical understanding of the different types of charts and tables. By elucidating each chart type through clear examples, students can visualize how data is presented diversely. The questions offered aid in immediate practice and reinforce their ability to interpret and extract information accurately from the presented charts and tables.
Relevant Topics
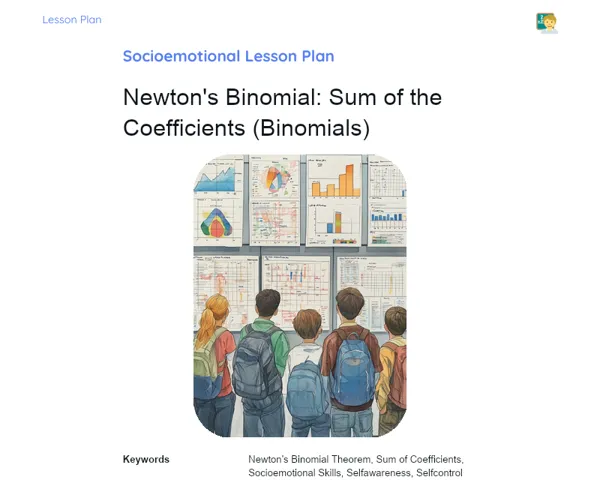
1. 📊 Bar Chart: Explain how this chart type utilizes rectangular bars to represent data. Each bar signifies a category, with its length proportionate to the value it depicts. Use a simple example, like a chart illustrating the favourite fruits of a class (apple, banana, orange, etc.).
2. 📈 Line Chart: Clarify that this chart type connects points with lines to depict value changes over time, making it useful for visualizing trends. Present an example such as the fluctuation in temperature throughout a week.
3. 📋 Tables: Discuss how tables arrange data into rows and columns, facilitating easier information comparison. Present a simple table, perhaps displaying scores of various teams in a school tournament.
4. 🖼️ Pictorial Charts: Explain that these charts use images or icons for an engaging representation of data. An example could feature book icons denoting the number of books read by students in a month.
To Reinforce Learning
1. Look at the bar chart detailing the number of apples, bananas, and oranges liked by a class. How many students preferred bananas?
2. Examine the line chart who illustrates temperature across a week. What was the temperature recorded on the third day?
3. Evaluate the table with scores of teams A, B, and C in a school tournament. Which team achieved the highest score?
Feedback
Duration: 20 - 25 minutes
📚 Purpose: This stage aims to help students consolidate their understanding of concepts from the lesson. Discussing the answers to the posed questions provides an opportunity for clarifying doubts, reinforcing learning, and nurturing critical skills in data interpretation. This also fosters active engagement, making learning more dynamic and interactive.
Diskusi Concepts
1. 📝 Discussion of the Presented Questions: 2. Bar Chart: In the bar chart illustrating the number of apples, bananas, and oranges preferred by a class, students should notice the bar designated for bananas and determine the number of students favouring it. For instance, if the banana bar reaches 10, that indicates 10 students prefer bananas. 3. Line Chart: In the line chart displaying temperature variation across a week, students should identify the third point on the horizontal axis (indicating the third day) and observe its height on the vertical axis, representing the temperature. If the line on that day sits at 25°C, then the temperature was indeed 25°C. 4. Table: In the table showcasing scores of teams A, B, and C in a school tournament, students should compare the values listed under each team's column. The team with the highest score is the one with the maximum points. For example, if team A has 50 points, team B has 70 points, and team C has 65 points, team B has the highest score.
Engaging Students
1. 💬 Questions and Reflections for Student Engagement: 2. What criteria did you employ to determine the number of students who preferred bananas in the bar chart? 3. Why is it crucial to notice changes over time in a line chart? Can you cite other examples where this would be beneficial? 4. When comparing information in a table, which strategies assist you in quickly identifying the highest value? Would you apply these strategies to other situations in your school life? 5. How do varied chart types aid in visualizing data distinctively? Which chart type do you find simplest to grasp, and why? 6. Can you concoct an example of a pictorial chart representing a dataset from your life?
Conclusion
Duration: 10 - 15 minutes
This stage aims to solidify learning by recapping the main points observed in the lesson and emphasizing the importance of the content. Summarizing, linking, and underscoring its practical relevance encourages students to reflect on their learning and apply this knowledge in their daily lives.
Summary
['Explanation of the various chart types: bar, line, table, and pictorial.', 'Demonstration of how to interpret data presented in these charts.', 'Practical examples of charts and tables using fictitious data.', 'Questions for practicing interpretation and information extraction from charts and tables.', 'Discussion of answers and prompts for student engagement through reflective questions.']
Connection
The lesson integrated theory with practice by showcasing charts and tables that mirrored data from daily life, such as fruit preferences, temperature shifts, and tournament scores. This strategy helped students visualize the practical utility of the concepts discussed, lending relevance to their learning experience.
Theme Relevance
Grasping charts and tables is essential in everyday scenarios, as these tools are utilized in various contexts including news coverage, academic reports, sports statistics, and even social media. Being adept at interpreting this data equips students to make informed decisions, better understand their surroundings, and cultivate vital analytical abilities for the future.