
Chapter 4: Presentation, Analysis, and Interpretation of Data
Introduction to the Power of Data and its Visualization; Understanding Data Tables: Structure, Types, and Design Principles; Interpreting Tabular Data for Meaningful Insights; Introduction to Graphical Representations: Bar Graphs, Line Graphs, Pie Charts, Histograms, Scatter Plots, Area Graphs, and Box Plots; Interpreting Various Graph Types for Trends, Distributions, and Relationships; Strategic Selection of Data Presentation Tools; Ethical Considerations and Common Pitfalls in Data Presentation; Applying Analytical Skills to Real-World Datasets; Synthesizing Insights and Fostering Data Literacy for the Future

Need customized slides for your lessons?
I can generate slides, activities, summaries, and 60+ types of materials. That's right, no sleepless nights here :)
People who viewed this slide also liked...


Presentation
Jamaica's Special Heroes

Shaneike Bell
-
Presentation
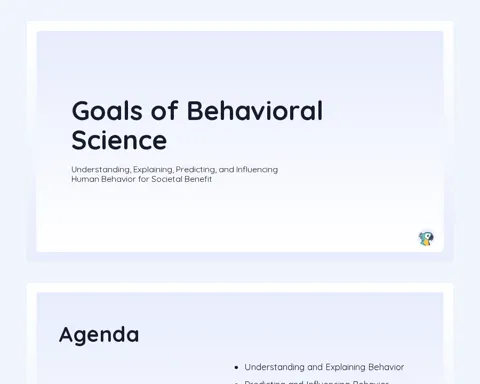
Goals of Behavioral Science
GR
Gamer Rock
-

Presentation
Sources of Effective Teaching
ZI
Zohaib Iqbal
-

Presentation
Unveiling Cultural Diversity

JEFFERSON BON
-

Join a community of teachers directly on WhatsApp
Connect with other teachers, receive and share materials, tips, training, and much more!

Reinvent teaching













Resources
2026 - All rights reserved