
Exploratory Data Analysis (EDA)
Descriptive Statistics: Understanding central tendency and dispersion using mean, median, variance, and IQR, with practical application via Pandas.; Distribution Analysis: Visualizing data distributions through Histograms, Boxplots, and Kernel Density Estimation (KDE) plots.; Relationships Between Variables: Exploring multivariate relationships using Scatterplots, Pairplots, and Correlation Heatmaps.; Outlier Detection: Identifying anomalous data points using Boxplots, Z-score, and IQR methods.; Categorical Data Exploration: Analyzing qualitative data distributions with Bar Charts and Count Plots.; EDA Report Writing: Structuring comprehensive reports, interpreting findings, and deriving actionable insights.

Need customized slides for your lessons?
I can generate slides, activities, summaries, and 60+ types of materials. That's right, no sleepless nights here :)
People who viewed this slide also liked...

Presentation
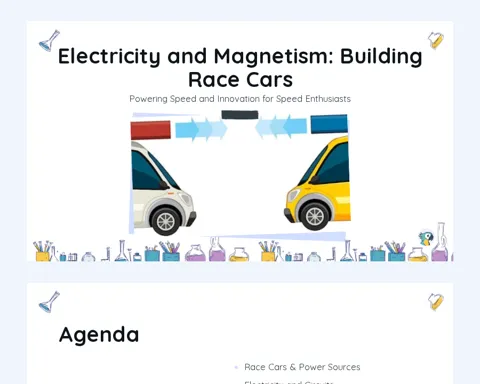
Electricity and Magnetism: Building Race Cars

Latonya Mcclendon
-

Presentation
Animal Organ Systems Diversity
NU
Naruto Uzumaki
-

Presentation
Living or Not Living?

AMMY FAYEZ
-
Presentation
Cell Division: Mitosis
MF
Mariam Fuad
-

Join a community of teachers directly on WhatsApp
Connect with other teachers, receive and share materials, tips, training, and much more!

Reinvent teaching













Resources
2026 - All rights reserved