Summary of Analysis of Economic Data
This summary provides an overview of analysing economic data, a crucial skill for economists in South Africa and globally. It will cover the types of data, methods of graphical representation, and some statistical measures, with a focus on intuition over mathematical rigor. This summary aims to equip university students with the fundamental tools for understanding and interpreting economic information.
Types of Economic Data
- Time Series Data: This involves observations of a variable over time, such as South Africa's GDP from 1990 to 2023.
- Data is ordered chronologically and can be collected at various frequencies (annual, quarterly, monthly, etc.).
- Examples include inflation rates, interest rates, and stock prices.
- Notation: represents the observation of variable at time .
- Cross-Sectional Data: This involves observations of different units (individuals, firms, countries) at a single point in time.
- Examples include wages of workers in the South African mining industry in 2023 or GDP per capita for various African countries in 2023.
- The order of data typically does not matter.
- Notation: represents the observation of variable for individual .
- Panel Data: This combines both time series and cross-sectional dimensions.
- It involves tracking the same units over multiple time periods.
- Example: GDP for a set of SADC countries over a period of 20 years.
- Notation: represents the observation of variable for unit at time .
- Qualitative vs. Quantitative Data:
- Quantitative data are numerical (e.g., sales figures, GDP).
- Qualitative data are categorical (e.g., Yes/No responses, union membership). Economists often convert qualitative data into numeric form (e.g., 1 for Yes, 0 for No), creating dummy or binary variables.
Data Transformations
- Levels vs. Growth Rates: Data can be analysed in levels (actual values) or as growth rates (percentage changes).
- Growth rates are often used to understand how an economy is changing over time.
- Formula for percentage change:
- Index Numbers: These are used to measure changes in a variable relative to a base period (set to 100).
- Example: Consumer Price Index (CPI) in South Africa, measuring changes in the price level over time.
- Useful for tracking inflation and other economic trends.
- Real GDP is calculated by dividing nominal GDP by a price index (GDP deflator) to adjust for inflation.
Obtaining Data
- Sources: Economic data can be obtained from various sources, including:
- National accounts from Statistics South Africa (Stats SA).
- Surveys of households, employment, and businesses.
- International organizations like the World Bank and the International Monetary Fund (IMF).
- Online databases and resources, such as the South African Reserve Bank (SARB) and academic websites.
Graphical Methods
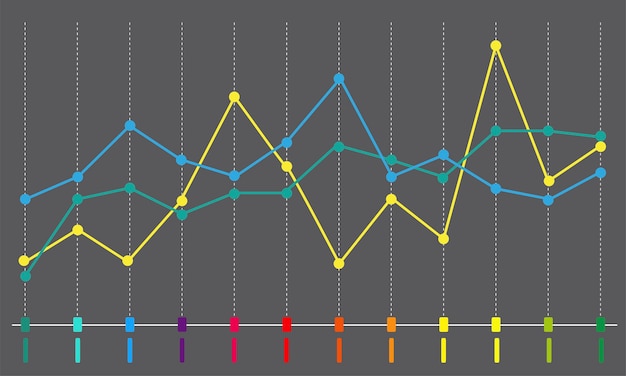
- Time Series Graphs: These plot a variable over time, showing trends and patterns.
- Histograms: These display the distribution of a variable, showing the frequency of different values or ranges of values.

- Useful for summarising cross-sectional data.
- XY-Plots (Scatter Diagrams): These show the relationship between two variables.
- Useful for identifying correlations and potential causal relationships.
Descriptive Statistics
- Mean: The average value of a variable.
- Formula:
- Standard Deviation: A measure of the dispersion or spread of a variable around its mean.
- Indicates how much the individual data points deviate from the average.
- Minimum and Maximum: The smallest and largest values of a variable.
- Percentiles, Quartiles, and Deciles: These divide the data into different portions, providing information about the distribution.
Conclusion
Analysing economic data involves understanding the types of data available, transforming data appropriately, visualising data using graphical methods, and summarising data using descriptive statistics. These tools provide a foundation for making informed decisions and understanding economic phenomena in South Africa and the world. Remember that the ability to interpret and contextualise data is just as important as the technical skills involved in its analysis.