Goals
1. Understand the basic concepts of cartography, including the definition and use of maps, plans, sketches, and charts.
2. Identify and differentiate various types of cartographic products and their practical applications in daily life and the job market.
Contextualization
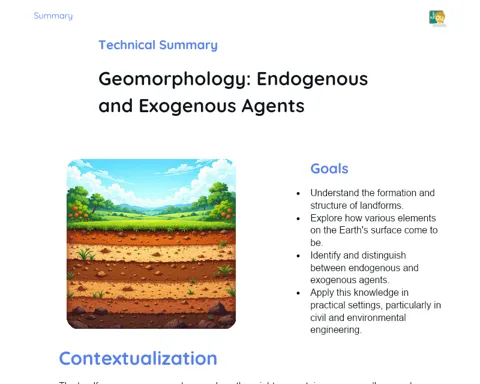
Cartography is a fascinating field that helps us make sense of and visually represent geographical spaces. From ancient hand-drawn maps to cutting-edge geoinformation systems, cartographic products play a vital role in navigation, urban planning, environmental management, and even tourism. For example, civil engineers rely on detailed maps to design urban infrastructure, while architects utilize plans to create building designs. Knowing how to interpret and produce these materials is essential across different fields of study and the professional landscape.
Subject Relevance
To Remember!
Maps
Maps serve as graphic representations of the Earth's surface or parts of it, showcasing various physical, political, economic, or social features. They are integral for navigation, planning, and geographical studies.
-
Represent the Earth's surface on a smaller scale.
-
Can be physical, political, economic, thematic, among others.
-
Essential tools for navigation and urban planning.
Plans
Plans are detailed representations of smaller areas, such as buildings or land plots, typically drawn to a larger scale than maps. They are mainly used in fields like architecture, engineering, and urban planning.
-
Detail smaller areas, such as buildings and land.
-
Used extensively in architecture, engineering, and city planning.
-
Aid in the planning and execution of construction projects.
Sketches
Sketches are quick and simplified drawings of spaces. Unlike detailed plans or maps, they do not need to be exact and are often used for preliminary ideas and initial drafts.
-
Provide quick, simplified visualizations.
-
Useful for initial drafts and early-stage planning.
-
Do not require precision but facilitate the first visualization of projects.
Charts
Charts are specialized representations of specific areas, commonly employed in maritime and aerial navigation. They contain vital information about natural and constructed features of the terrain.
-
Primarily used in maritime and aerial navigation.
-
Provide detailed and accurate information.
-
Critical for safety and efficient navigation.
Practical Applications
-
Urban Planning: Engineers and urban planners utilize maps and plans to design and develop cities, ensuring that infrastructure is both suitable and sustainable.
-
Navigation: Pilots, sailors, and drivers depend on charts and maps to navigate safely, avoiding hazards and planning optimal routes.
-
Information Technology: Software developers design digital maps and GPS applications that assist people in orienting themselves and locating specific places.
Key Terms
-
Cartography: The science that examines the methods and techniques for creating and interpreting maps.
-
Map: A graphic representation of the Earth's surface or sections of it, presented on a reduced scale.
-
Plan: A detailed drawing of a smaller area, such as a structure or plot.
-
Sketch: A quick and simplified representation of an area.
-
Chart: A detailed representation of a specific area, primarily used for navigation.
Questions for Reflections
-
How might the accuracy of maps influence urban planning and resource management?
-
In what ways are modern technologies reshaping cartography and its usage in daily life?
-
What challenges do cartographers encounter in creating precise and meaningful spatial representations?
Creation of a Neighborhood Sketch
To solidify your understanding of cartography and spatial representation, your challenge is to create a detailed sketch of the neighborhood around your home.
Instructions
-
Step outside and explore your neighborhood for 10 minutes, noting key areas and points of interest like streets, parks, shops, and landmarks.
-
Use graph paper, a ruler, and a pencil to draw a sketch of your neighborhood.
-
Include scales and legends to indicate various areas and elements.
-
Be creative and precise in your representation, while keeping in mind that a sketch can be simplified.
-
Compare your sketch with a digital map of your neighborhood to verify its accuracy and identify potential improvements.